
Texas Car Culture: How Distance, Heat, Tolls, and Family Life Shape What People Drive
A statewide map of Texas car culture across Dallas–Fort Worth, Houston, Austin, and San Antonio—where sprawl, heat, hail, flooding, toll networks, insurance, and multigenerational routines decide ownership long before badge preference does.
Texas driving is defined by scale: multi-metro freeways, heat and hail, Gulf flooding risk, toll networks, and household calendars that often need more than one vehicle. Ownership choices range from working trucks and three-row crossovers to hybrids and home-charged EVs in denser cores.
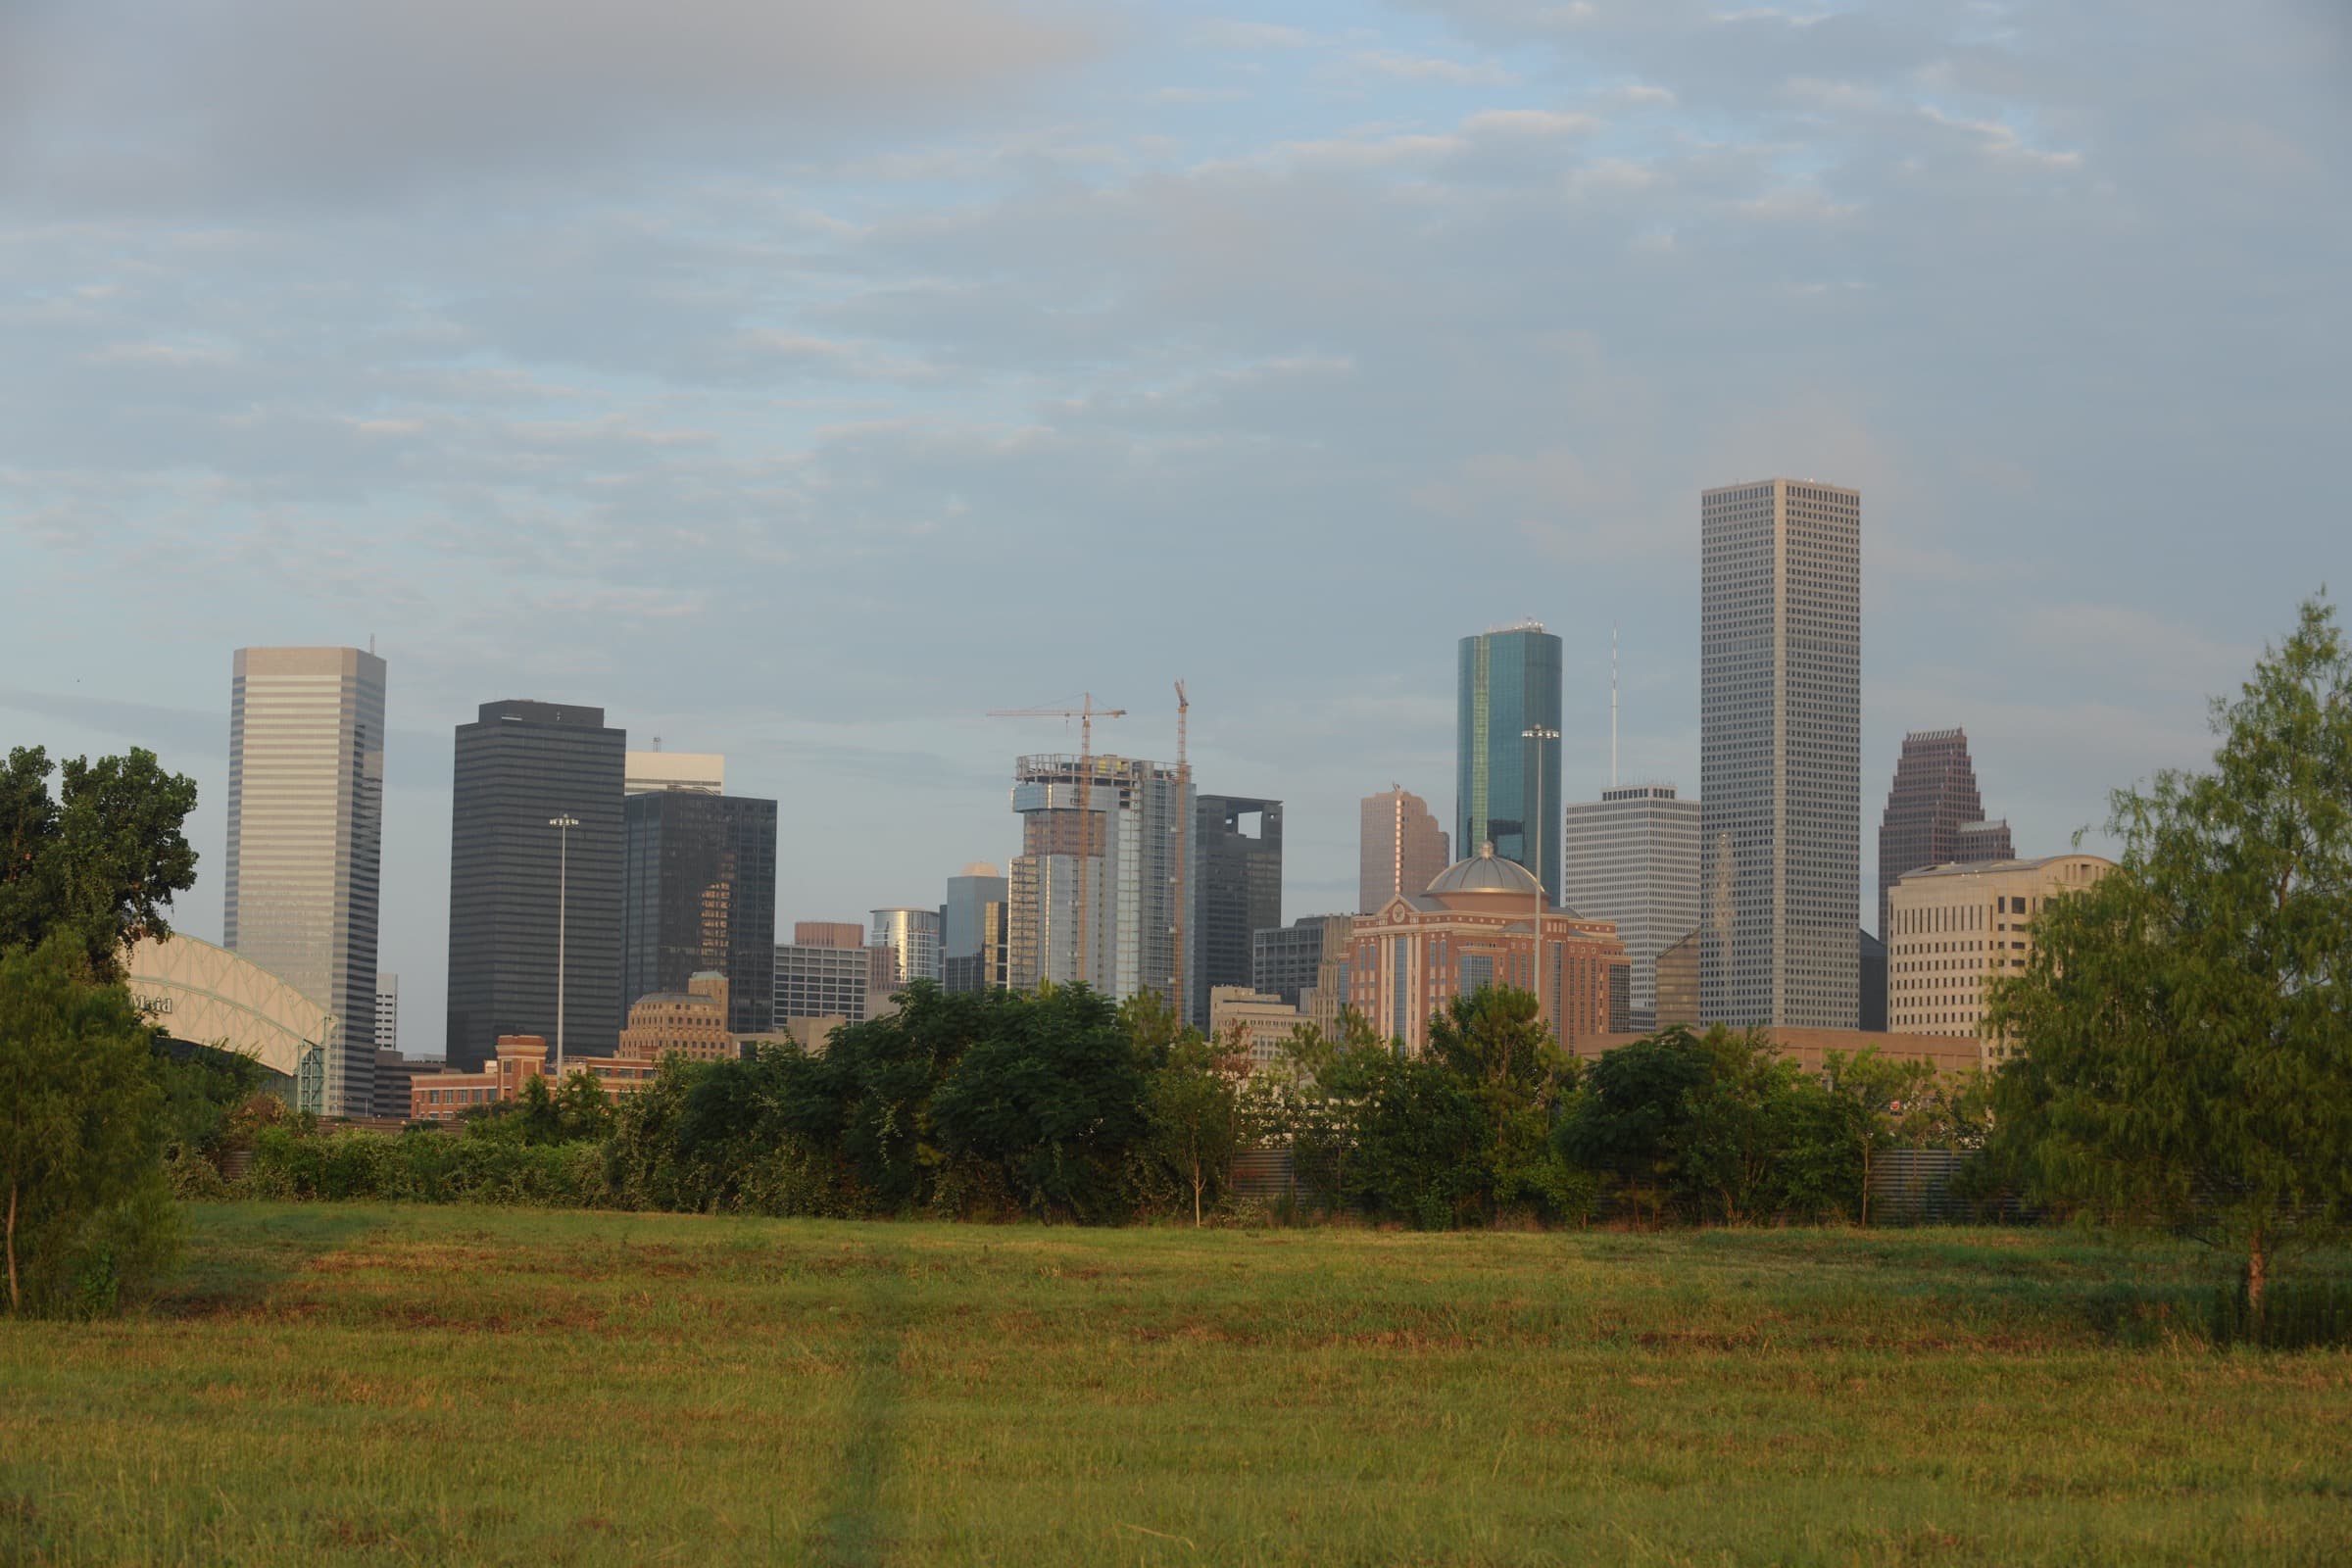
Community context
Communities in Houston, Dallas–Fort Worth, Austin, San Antonio, Plano, Frisco, Sugar Land, and Katy bring multigenerational routines and diverse preferences. Suburban homeownership, long commutes, and inter-city family visits shape vehicle choices without prescribing a single brand or body style.
Explore Texas by commute, neighborhood, and driving need
These guides separate local ownership questions into focused pages while this hub keeps the region-wide context and comparisons.
Dallas–Fort Worth Car Ownership
A practical DFW ownership guide covering Dallas, Fort Worth, Plano, Frisco, and Arlington households, toll roads, TEXpress lanes, transit, theft, hail, heat, and charging.
Ownership realityHouston Car Ownership
A practical ownership map for Houston, Harris County, and Fort Bend County covering freeways, tolls, transit, freight, flooding, heat, theft, charging, family schedules, and airport duty.
Ownership realityAustin–San Antonio Car Ownership
I-35 construction, toll roads, transit, charging, heat, airport trips, shift work, and family vehicle decisions from Austin to San Antonio.
Ownership mathTexas Ownership Costs, Tolls, Insurance, and Registration
Worked Texas car-cost math for sales tax, title, registration, the 2025 inspection change, EV fees, insurance, tolls, fuel, electricity, tires, and A/C.
Seasonal safetyTexas Seasonal Driving: Heat, Hail, Flooding, and Hurricanes
A statewide vehicle-preparedness guide for extreme heat, flash flooding, hurricanes, hail, tornadoes, wildfire, winter ice, fuel and EV reserves, DriveTexas, and official alerts.
Car cultureTexas Trucks, Slabs, Lowriders, and Motorsport
A respectful guide to working trucks, Houston slabs and swangas, lowriding, art cars, sanctioned racing, and the institutions that sustain Texas car culture.
Key numbers for Texas car buyers
- Dallas–Fort Worth MSA
- 8.48M
- U.S. Census Bureau July 1, 2025 estimate for the Dallas–Fort Worth–Arlington metropolitan statistical area.
- Houston MSA
- 7.90M
- U.S. Census Bureau July 1, 2025 estimate for the Houston–Pasadena–The Woodlands metropolitan statistical area.
- San Antonio MSA
- 2.81M
- U.S. Census Bureau July 1, 2025 estimate for the San Antonio–New Braunfels metropolitan statistical area.
- Austin MSA
- 2.62M
- U.S. Census Bureau July 1, 2025 estimate for the Austin–Round Rock–San Marcos metropolitan statistical area, the fastest-growing of the four major Texas metros from 2020 to 2025.
- Registered Texas vehicles
- 26.9M
- Texas Department of Motor Vehicles count as of August 31, 2025, across passenger vehicles, trucks, trailers, and other registered classes.
- 2025 Texas regular gasoline
- $2.660/gal
- U.S. EIA annual average for Texas regular all-formulations retail gasoline. Local pump prices and diesel differ; use a current neighborhood price for live math.
- 2023 NAIC auto expenditure
- $1,428.94
- NAIC Auto Insurance Database Average Premium Supplement (through 2023). Texas ranked 13th nationally; countrywide average was $1,281. ZIP code, coverage, and weather exposure still require a direct quote.
- Sugar Land / Frisco Asian alone
- 38.7% / 28.1%
- Census QuickFacts Asian alone shares for Sugar Land and Frisco. Plano is 23.7%. Demographics describe communities and schedules, not brand preferences.
Texas is several car cultures sharing the same scale
Texas driving is easiest to misunderstand when it is reduced to one image: a pickup on a farm-to-market road, a three-row SUV in a Plano school line, a slab on Houston's West Side, or an EV charging beside a downtown condo. Those scenes share geography and heat. They do not share the same toll systems, flood risk, commute corridors, or household calendars. A useful statewide guide begins by asking what the vehicle must do every week—and where it will wait when it is not moving.
Distance is the first filter. Census July 2025 estimates place the four major metros at roughly 8.5 million in Dallas–Fort Worth, 7.9 million in Houston, 2.8 million in San Antonio, and 2.6 million in Austin. Inter-city weekends, airport duty, and suburban job centers can produce annual mileage that dwarfs a coastal urban year. Fuel at Texas's 2025 regular average of about $2.66 per gallon looks mild next to California, but 15,000 to 20,000 miles a year still turns efficiency, tires, and service intervals into real ownership lines.
Weather is the second filter. Extreme heat makes cabin cooling, coolant health, and tire pressure routine rather than seasonal. North Texas hail and Gulf flooding change insurance and parking decisions. Hurricane preparedness is a coastal and inland logistics problem, not a body-style preference. The seasonal child guide covers equipment and official alerts; the metro children translate those risks into local ownership tests.
Tolls and insurance are the third filter. NTTA, HCTRA, CTRMA, and other operators price reliability differently, and ZipCash or pay-by-mail rates can double a tagged trip. NAIC's 2023 Texas expenditure figure of about $1,429 is a statewide reference, not a Dallas or Houston quote. Comprehensive coverage for hail or flood exposure can matter as much as the payment on the window sticker.
Community context belongs in the map without becoming a stereotype. Census QuickFacts put Sugar Land’s Asian alone share at 38.7%, Frisco at 28.1%, and Plano at 23.7%. Sugar Land, Katy, Richardson, Carrollton, and other suburbs carry their own multigenerational routines, language patterns, and restaurant-and-temple trip chains. Those facts justify attentive household testing. They do not prescribe a brand, a truck, or a three-row default.
Start with a weekly household map before shopping: workplaces, school or caregiving stops, airport runs, flood or hail parking options, charging control, and any trips that happen at the same time. That map reveals whether the household needs one versatile vehicle, two specialized vehicles, or a car paired with transit, rideshare, or rentals. The child guides below turn each metro and cost problem into a focused decision.
Freeways, toll networks, and transit in one statewide view
I-35, I-45, I-10, I-20, I-30, and I-45's coastal approaches organize Texas's major metros more than any single downtown skyline. Dallas–Fort Worth layers NTTA tollways and TEXpress lanes onto that map. Houston adds HCTRA systems and freight-heavy corridors. Austin and San Antonio share I-35 construction pressure and separate local toll authorities. Treat each network as a priced reliability option, not a free upgrade included with the car.
Transit can change vehicle count when endpoints cooperate. DART, Trinity Metro, Houston METRO, CapMetro, and VIA serve different jobs and schedules. A rail-plus-one-car household can be more resilient than two financed SUVs covering every solo commute. Test the full chain—parking, last mile, late return—before treating a nearby station as proof.
Texas had 26.9 million registered vehicles as of August 31, 2025. That scale supports multi-car garages in many suburbs and makes unused capacity expensive when insurance, registration, tires, and parking accumulate. The ownership-costs child walks through tax, title, registration, EV fees, and worked monthly totals without forcing every metro into one average.
Statewide ownership patterns before you shortlist
The multi-metro family
Relatives in Dallas, Houston, or San Antonio turn occasional I-45 or I-35 trips into recurring mileage. Choose highway comfort and efficiency for the real calendar, then rent for rare seven-passenger outings if the daily vehicle does not need a third row.
The hail-and-heat suburban household
Covered parking, comprehensive insurance, and afternoon A/C performance can matter more than badge prestige. Quote insurance for the exact ZIP code and trim before treating a premium crossover as the default.
The Gulf Coast flood planner
Evacuation fuel or charge reserves, a go-bag, and a refusal to drive into floodwater belong in ownership planning. Ground clearance is not a substitute for official alerts or Turn Around Don't Drown guidance.
The one-car plus transit experiment
Where DART, METRO, CapMetro, or VIA can remove a difficult commute, test one capable household vehicle against two payments. Include station parking, late meetings, and caregiving before declaring the experiment a failure.
Charging and powertrain choices at Texas distances
A home-charged EV can suit predictable suburban mileage when the household controls overnight charging and accepts summer cabin-cooling loads. Public fast charging supports travel and exceptions; it is a weak weekly foundation when every charge requires moving the car and competing for working stalls.
An efficient hybrid remains strong for renters, uncertain charging, and high inter-city mileage. A PHEV earns its battery only when it is plugged in often enough to cover recurring local trips. Compare the whole ownership stack—payment, insurance, tires, registration, and energy—rather than EPA range alone.
Texas electricity rates, HOA rules, and apartment stall control vary widely. Use the public-versus-home charging and hybrid-versus-EV calculators with the household's actual bill and schedule before treating any powertrain as the statewide answer.
What to carry into the showroom
Texas car culture rewards vehicles that survive the household map: distance, heat, weather exposure, toll reliability, insurance, and the passengers who ride every week. Start with that map, then open the metro or cost guide that matches your address.
Choose the smallest, most efficient vehicle that clears the repeated hard trip. Rent for rare extremes. Revisit the plan after a job change, a move between metros, a charger installation, or a new insurance quote.
The statewide culture is plural—trucks, slabs, lowriders, motorsport, family SUVs, and practical hybrids coexist. Participate respectfully, and let the child guides carry the local detail this hub intentionally leaves open.
Related guides
- Dallas–Fort Worth Car Ownership
- Houston Car Ownership
- Austin–San Antonio Car Ownership
- Texas Ownership Costs, Tolls, Insurance, and Registration
- Texas Seasonal Driving: Heat, Hail, Flooding, and Hurricanes
- Texas Trucks, Slabs, Lowriders, and Motorsport
- Commute Cost Calculator
- Car Affordability Calculator
- Hybrid vs EV Monthly Calculator
- Public vs Home Charging Calculator
- Best Cars for Long Commutes
- Best Cars for Multigenerational Households
- Dallas to Austin Road Trip
- Hybrid vs EV for City Drivers
Driving patterns
- ·Long suburban commutes on multi-lane freeways and priced toll corridors
- ·Inter-city drives among Dallas, Austin, Houston, and San Antonio
- ·Heat-intensive daily driving with heavy A/C use and tire pressure swings
- ·Seasonal planning for hail, flash flooding, hurricanes, and rare ice events
Likely vehicle needs
- ·Strong A/C performance and heat management
- ·Highway comfort and efficiency for high annual mileage
- ·Insurance and parking strategy for hail and flood exposure
- ·Capacity matched to real household trips, not rare extremes
EV and hybrid fit
Home-charged EVs can work for predictable suburban mileage when overnight charging is controlled. Hybrids remain strong for renters, uncertain charging, and high inter-city mileage. Public fast charging supports travel; it is a weak weekly foundation.
Luxury and status signals
Full-size luxury SUVs and premium trucks remain visible at Texas scale. In professional suburban corridors, quiet highway crossovers and efficient luxury hybrids often beat badge prestige alone.
Family and multigenerational considerations
Multi-car garages are common, but unused capacity still costs insurance and registration. Three-row SUVs earn their keep when school, caregiving, and airport duty collide; otherwise one capable vehicle plus rentals can be the saner plan.
Road trip ideas
Related buying guides
Best Cars for Long Commutes
Practical framework for shoppers in this region.
Best Cars for Multigenerational Households
Practical framework for shoppers in this region.
Best Luxury SUVs for Family Road Trips
Practical framework for shoppers in this region.
Dallas to Austin Drive: Distance & Drive Time
Practical framework for shoppers in this region.
Best Cars for Asian American Families
Practical framework for shoppers in this region.
Hybrid vs EV for City Drivers
Practical framework for shoppers in this region.
EV and hybrid guides
Relevant Drive Notes
Rivian’s 2027 R1S Finally Gets Second-Row Captain’s Chairs
The 2027 R1S adds optional second-row captain’s chairs with a center pass-through, Rivian’s most-requested interior feature since launch. The R1 lineup also moves to Premium, Performance, and Quad trims, with starting prices of $83,990 for the R1S and $79,990 for the R1T.
PolicyThe World Already Chose Electric Cars. America Is Still Arguing
Elsewhere, electric cars already feel normal. In the U.S., they still feel like an argument. The International Energy Agency’s latest outlook shows why that gap is about policy and price, and why the destination is still electric.
Car CultureAn American Won the Freedom 250. The National Mall Was Already a Set.
Kyle Kirkwood led 128 of 147 laps and gave the Freedom 250 the American winner its pageantry demanded. Before the green flag there was a presidential parade lap, six branches of military flyovers, and a National Gallery that had boarded up its skylights just in case.