
Austin–San Antonio Car Ownership: I-35, Tolls, Transit, Heat, Charging, and the Household Week
From MoPac and central Austin construction to San Marcos, New Braunfels, northeast San Antonio, airports, factories, and family errands, the right vehicle depends on a corridor-wide schedule rather than a generic Texas preference.
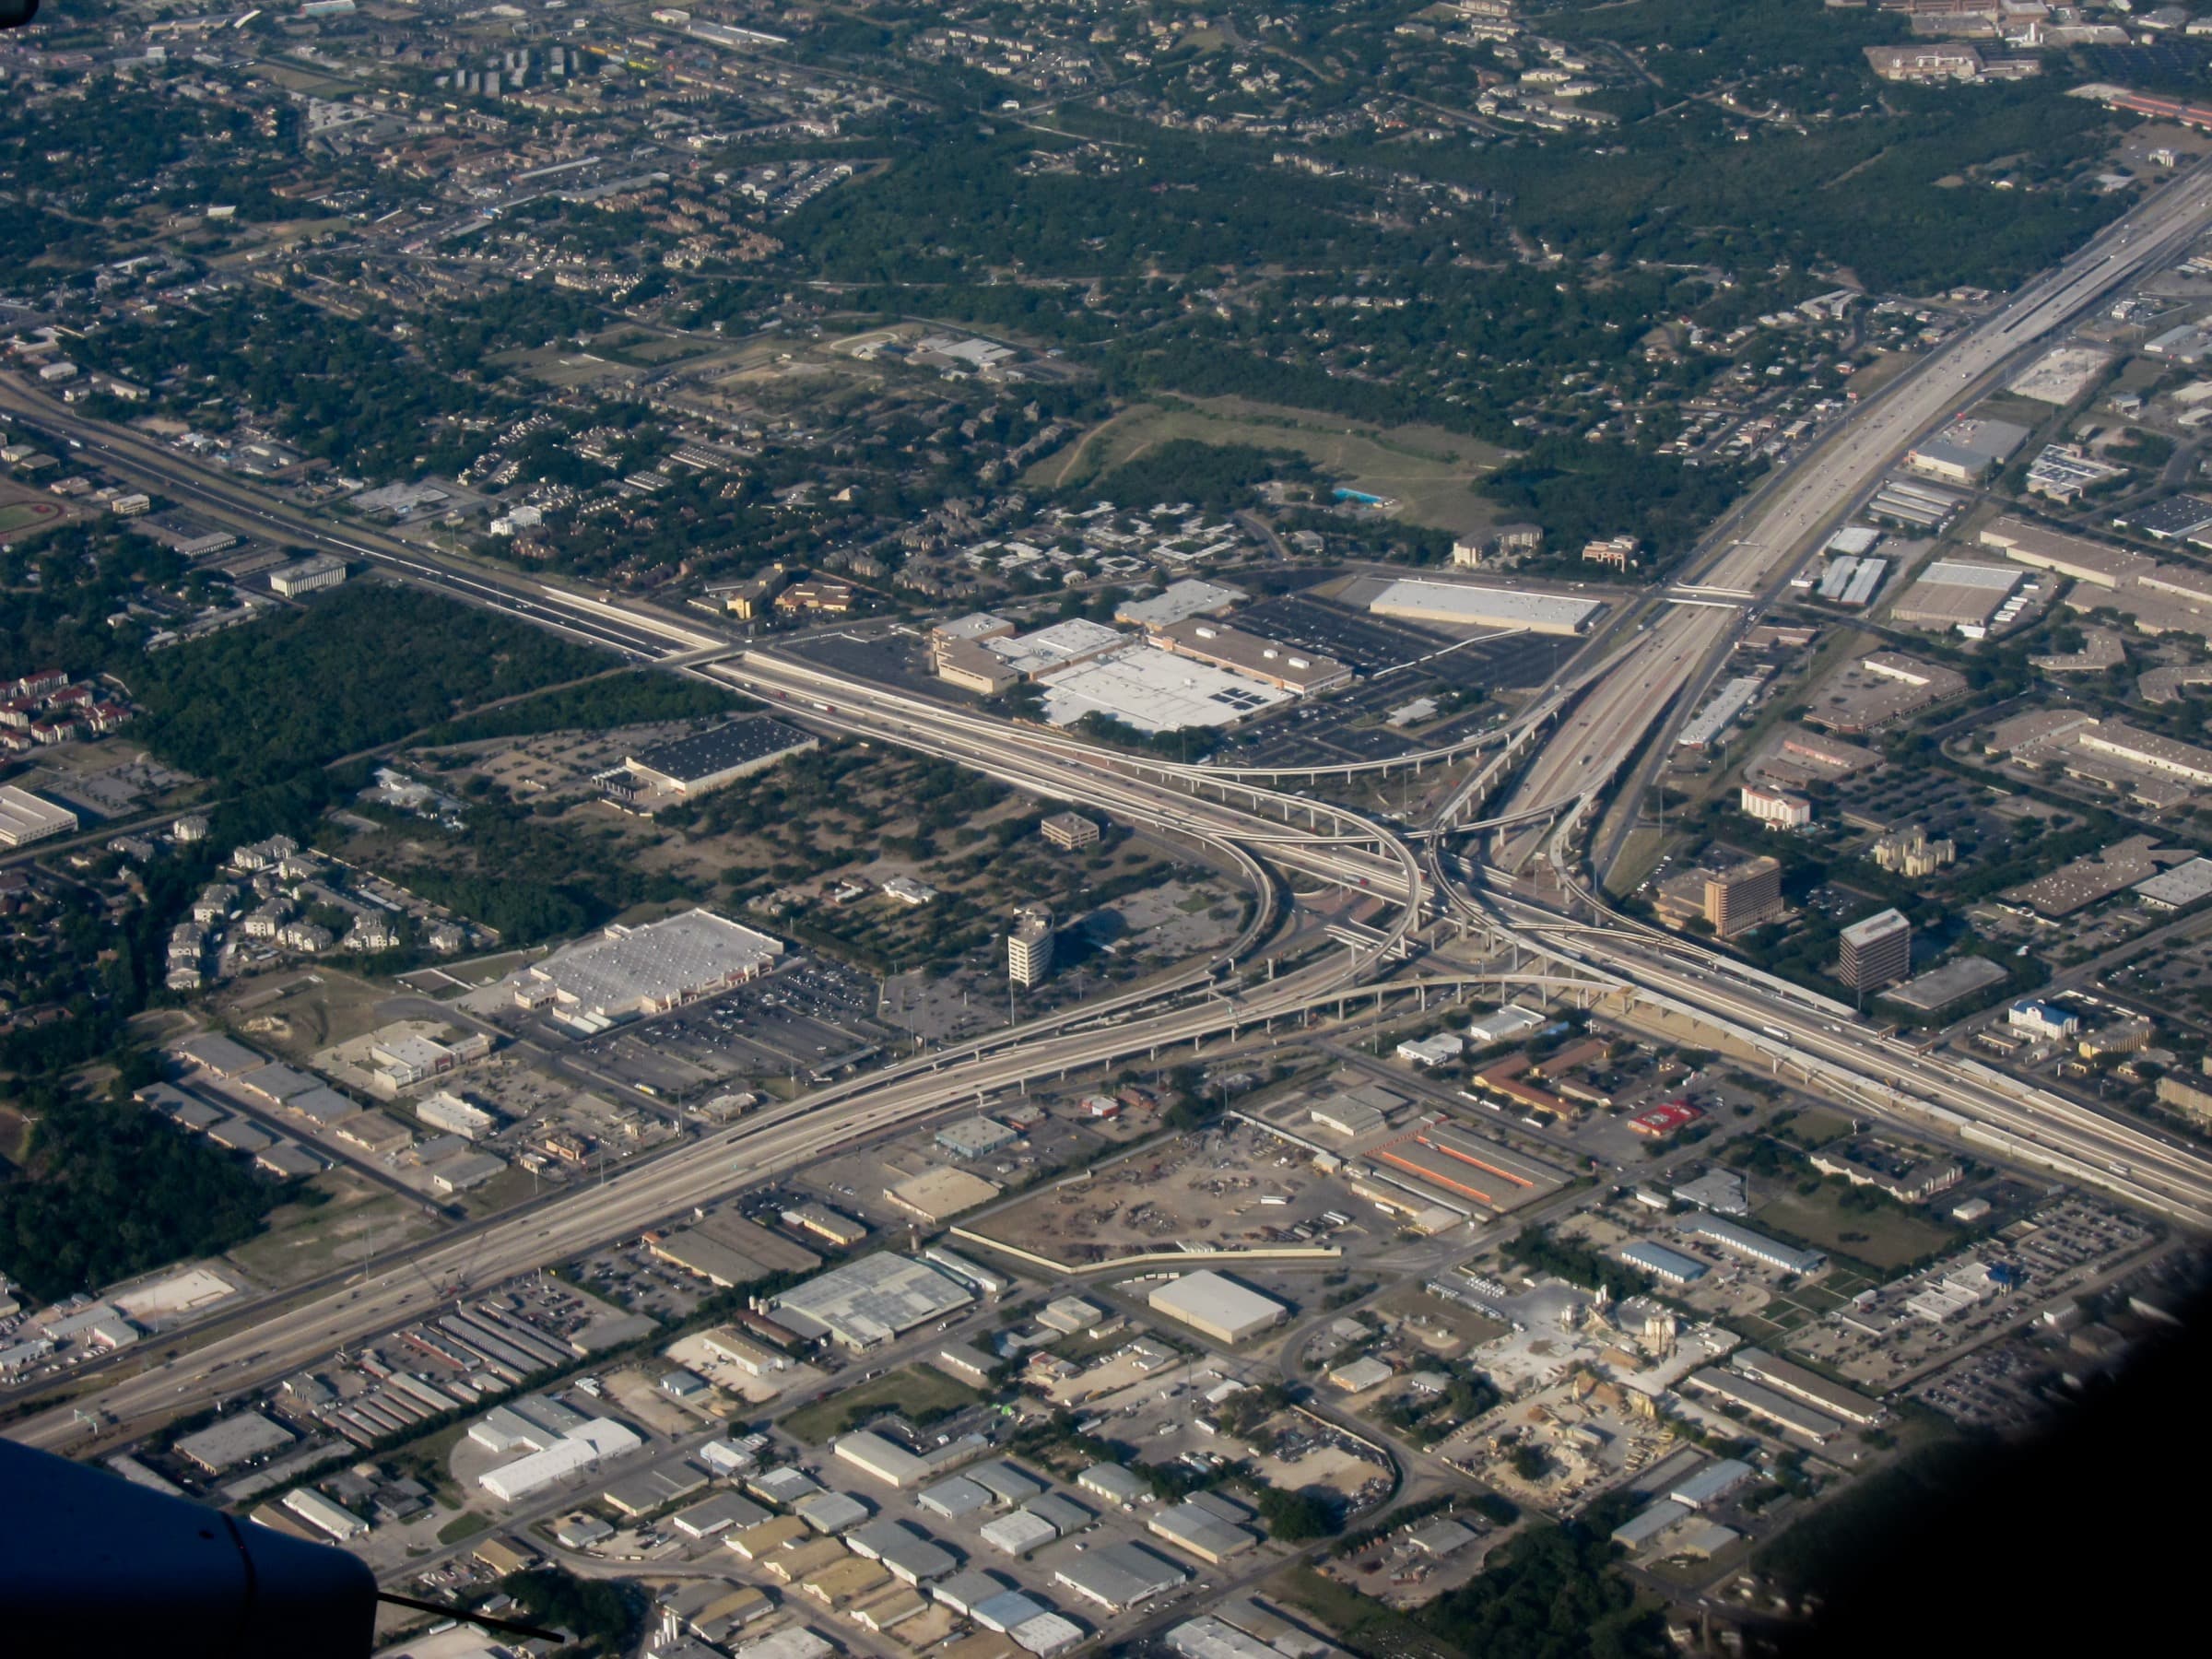
Key numbers for Austin–San Antonio Car Ownership
- Austin population
- 1,002,632
- U.S. Census Bureau July 1, 2025 estimate. Austin crossed one million residents while I-35, MoPac, SH 71, US 183, and local streets absorbed changing work and non-work travel.
- San Antonio population
- 1,548,422
- U.S. Census Bureau July 1, 2025 estimate, up 8.0% from the revised April 2020 estimate base.
- New Braunfels growth
- 35.5%
- Population growth from the April 2020 estimate base to July 1, 2025, reaching 122,492 residents. Its 2020–2024 mean commute was 27.1 minutes.
- Hays County commute
- 31.3 min
- 2020–2024 Census mean travel time to work, compared with 24.0 minutes inside San Marcos. Countywide averages better expose outward suburban commuting.
- Austin I-35 construction
- 2024–2033
- Current TxDOT schedule for the I-35 Capital Express Central program. The project adds two non-tolled managed lanes per direction and reconstructs central Austin segments.
- San Antonio I-35 NEX
- ~20 miles
- TxDOT program from North Walters Street to FM 1103. NEX Central targets late 2027 completion; South Phase 1 targets 2028, weather permitting.
- CapMetro FY2025 rides
- 26 million
- Unlinked trips across buses, trains, and vans, up 0.4% year over year. Transit can replace selected trips even when a household retains a car.
- Austin Energy Level 2 ports
- 1,400+
- Plug-In EVerywhere network count published by Austin Energy, with listed Level 2 charging at $0.09 per kWh. Availability and pricing are update-sensitive.
Treat the corridor as one household system
Austin and San Antonio are distinct metropolitan areas, but the ownership decision increasingly sits between them. A household may live in Kyle, Buda, San Marcos, New Braunfels, Schertz, or Cibolo while work, school, medical care, relatives, airport trips, and recreation pull in both directions. CAMPO's 2050 plan says direct downtown-to-downtown commuting remains limited, yet trips between suburban and satellite communities on each metro's edges are growing. That pattern matters more than a simple Austin-versus-San Antonio comparison.
Start with seven days rather than one rush-hour trip. Record every fixed obligation: work start and release times, school and daycare windows, eldercare, groceries, worship, medical appointments, sports, airport pickups, and weekend family visits. Mark whether each trip crosses I-35, requires a toll alternative, begins before transit service, ends after it, or carries passengers or equipment. A vehicle that seems excessive for one office commute may be justified by a tightly connected family schedule; a second vehicle may be hard to justify when one adult can reliably use transit or work from home.
The Census mean commute is 23.7 minutes in Austin and 24.5 minutes in San Antonio for 2020–2024, but those citywide means conceal corridor exposure. New Braunfels averaged 27.1 minutes, while Hays County averaged 31.3. CAMPO found that peak trips on heavily congested I-35 approaches in Hays and Williamson counties can take up to four times their free-flow duration. Model the bad recurring day, not only the map's uncongested estimate.
Construction belongs in the ownership budget. Austin's Capital Express Central project is expected to continue through 2033, while San Antonio's NEX program is building elevated lanes through northeast San Antonio, Live Oak, Selma, and Schertz. Flexible hours, backup routes, park-and-ride access, and realistic pickup buffers can matter more than acceleration or exterior size.
I-35, MoPac, SH 45, SH 130, transit, and airport runs
I-35 remains the corridor's central spine and its most visible point of failure. TxDOT's Austin project adds two non-tolled managed lanes per direction, lowers portions of the highway, removes the upper decks, and rebuilds the Lady Bird Lake crossing. San Antonio's NEX Central covers 9.5 miles from I-410 North to FM 3009, while South Phase 1 adds 4.2 miles. Check current closure maps before describing any ramp as permanently available.
MoPac serves north–south Austin trips west of downtown. Its existing express lane uses variable pricing; the posted roadside price controls. A separate MoPac South proposal remained in environmental review in 2026, with a recommended concept extending express lanes from Cesar Chavez Street to Slaughter Lane. Proposed lanes should not be written as open infrastructure. For a household considering west or southwest Austin, test the current general-purpose route, the existing express lane, and local alternatives at the actual travel time.
SH 45 and SH 130 can buy predictability, but the corridor has multiple operators and billing systems. CTRMA operates 45SW, 183A, 290 Toll, 71 Toll, 183 Toll, and the MoPac Express Lane. TxDOT-owned Austin roads are billed through HCTRA, while SH 130 Segments 5 and 6 publish a separate schedule. Maintain an active interoperable tag and calculate tolls by exact entry, exit, axle count, and payment method.
As one scale reference, CTRMA listed the 45SW Bear Creek mainline rate for a two-axle vehicle at $1.26 with a tag and $1.89 by mail in its 2026 rate table. SH 130 South prices vary much more by segment and class. Never turn one plaza price into a corridor total. Multiply the official trip-planner result by actual commute frequency before deciding that a faster route is affordable.
CapMetro provided 26 million rides in FY2025. Its network includes local, Rapid and Express buses, Pickup service, and the Red Line between downtown Austin and Leander. McKalla Station opened in 2024; older references to Broadmoor should not be presented as current service. Transit is most useful when both ends of the trip align with service and the last mile is manageable. A household may still save substantially by replacing one commuter car rather than every car trip.
VIA reported nearly 31 million trips in calendar 2024 and 35% year-over-year growth in VIA Link during 2025. VIA Link can solve selected first- and last-mile trips inside designated zones. The 10.35-mile Rapid Green Line was under construction with service expected in April 2028 as of June 2026, connecting near San Antonio International Airport through downtown toward the Missions area. Current bus and Link service should be judged on today's schedule; the Green Line belongs in a future reassessment.
Airport duty adds irregular hours, luggage, curb congestion, and parking cost. Before sizing a vehicle around airport pickups, count how often the household carries four adults plus luggage. For occasional large loads, a rental or coordinated two-vehicle pickup can cost less than driving an oversized vehicle all year.
How ownership changes along the corridor
These are mobility patterns, not rankings. Housing, job location, parking rights, and shift times can change the answer within the same city.
Central Austin and the university–downtown spine
Dense destinations, paid parking, strong bus coverage, cycling options, and years of I-35 construction can make a one-car household practical.
- ·Secure the parking space before choosing the vehicle
- ·Test transit for recurring work and university trips
- ·Price theft coverage, garage charging, and event-day access
North Austin, Round Rock, Pflugerville, and Taylor-facing jobs
Technology, semiconductor, medical, and distribution jobs create dispersed commutes that may not follow a conventional downtown peak.
- ·Map the exact campus entrance and shift-change queue
- ·Compare I-35, SH 130, US 183, and park-and-ride routines
- ·Prioritize seat comfort, efficiency, and dependable cooling
South Austin, Buda, and Kyle
Rapid housing growth meets constrained I-35 access, toll choices, and northbound job travel.
- ·Use Hays County commute conditions rather than Austin's city mean
- ·Budget SH 45 or SH 130 only when it solves a repeated delay
- ·Confirm school pickup feasibility during freeway incidents
San Marcos
Texas State University, a younger population, regional employment, and access to both metros create mixed local and corridor travel.
- ·Compare one shared household car with two lightly used cars
- ·Keep payment and insurance proportional to actual income
- ·Plan for apartment charging rather than assuming it
New Braunfels and Comal County
Fast population growth, tourism, family destinations, and commutes toward both metros make schedule reliability central.
- ·Model summer visitor traffic and recurring I-35 construction
- ·Check whether SH 130 helps the actual origin and destination
- ·Retain cargo capacity for the weekly family load, not an imagined maximum
Schertz, Cibolo, Selma, and northeast San Antonio
Military, logistics, medical, retail, and industrial work overlap with the active I-35 NEX construction zone.
- ·Check weekly NEX closures and ramp changes
- ·Evaluate VIA or employer transportation against the exact shift
- ·Favor predictable ownership costs over unused luxury equipment
Central, west, and south San Antonio
Downtown, the Medical Center, Port San Antonio, Brooks, military installations, and Toyota-area jobs create several different commute systems.
- ·Do not use one citywide commute assumption
- ·Test heat performance and rear-seat cooling with passengers
- ·Match truck or SUV capability to real work, towing, and family frequency
Heat, storms, and construction seasons
Extreme heat
- ·San Antonio tied for its second-warmest year on record in 2025; Austin-Bergstrom recorded its seventh-warmest
- ·Test front and rear air-conditioning performance before purchase
- ·Keep tires at the door-jamb specification and inspect heat-aged rubber
- ·Never leave a child, older adult, or animal in a parked vehicle
Flash flooding
- ·Check NWS alerts and DriveTexas before leaving
- ·Never enter still or moving floodwater
- ·Six inches of fast-moving water can cause loss of control, even in a pickup or SUV
- ·A taller vehicle does not make a flooded low-water crossing safe
Construction and event traffic
- ·Subscribe to TxDOT Capital Express and NEX updates
- ·Build Formula 1, festival, university, and tourism weekends into airport and family plans
- ·Keep a legal alternate route that does not depend on cutting through residential streets
Long summer parking
- ·Use shade or covered parking where practical
- ·Protect medicines, electronics, child-seat components, and pets from cabin heat
- ·Check the 12-volt battery, cooling system, wipers, and tire condition before corridor travel
Six corridor households
The hybrid Austin office schedule
One adult travels downtown three days a week while another works from home and handles nearby errands. Compare one efficient household car plus transit or ride-hail with two full ownership bills. A second vehicle should solve documented schedule conflicts, not hypothetical convenience.
The Kyle-to-north-Austin commuter
A long I-35 trip occurs five days a week. Prioritize fuel or energy consumption, seat support, adaptive cruise performance, tire cost, and a reliable backup route. Calculate SH 45 or SH 130 from the exact ramps before treating tolls as a fixed monthly number.
The New Braunfels two-direction household
One adult works toward Austin and the other toward San Antonio while children have fixed pickup times. Two vehicles may be justified, but they need not both be large. Pair an efficient commuter with the vehicle that carries the recurring family load.
The San Antonio shift worker
A hospital, airport, military, logistics, hospitality, or factory shift begins before frequent service or ends after it. Reliability, cooling, lighting, secure parking, and roadside support can outweigh premium features. Verify transit against the real shift before excluding it.
The renter considering an EV
Austin Energy advertises substantial charging support, but utility service territory and a dependable parking right come first. Obtain written property approval, an electrical assessment, installation cost, billing method, and rebate eligibility. Without dependable home or workplace charging, compare a hybrid with public-charging time and pricing included.
The airport-and-relatives vehicle
The household carries four adults and luggage several times per year but otherwise commutes with one or two people. Test whether a midsize vehicle, roof box, rental, or coordinated two-car pickup handles those rare loads more economically than a full-size SUV.
Austin Energy and CPS Energy are different charging systems
Austin Energy's 2025 home-charging program covered 50% of eligible Level 2 equipment and installation, up to $1,200 for a compatible Power Partner vehicle or station and up to $900 otherwise. Funding, service-territory eligibility, permits, licensed installation, equipment listing, and program terms apply. A mailing address labeled Austin does not by itself prove Austin Energy service.
Austin Energy also listed more than 1,400 Level 2 ports at $0.09 per kWh and DC fast charging at $0.21 per minute. Recheck those prices; per-minute charging produces different effective costs by vehicle and battery temperature.
CPS Energy's FlexEV Off-Peak Rewards program offered a one-time $50 bill credit and a $10 monthly credit for limiting charging during program peak hours, listed as weekdays from 4 p.m. to 10 p.m. Its public network FAQ listed 43 utility-owned ports, $1-per-hour charging with a two-hour minimum, and a $96 annual option. Recheck all figures because programs can change independently.
Texas also charges battery-electric vehicles a $200 annual renewal fee, with a $400 fee at initial two-year registration. Include that fee, charger installation, insurance, tires, public charging, and time spent charging in the comparison.
The key charging test is control: a dedicated space, permission, sufficient electrical capacity, transparent billing, and reliable access. Public charging works best as support rather than as an untested substitute for home charging.
What to carry into the showroom
The corridor rewards vehicles that reduce recurring friction: efficient operation, dependable cooling, comfortable seats, manageable dimensions, and enough passenger or cargo capacity for the household week. It does not create one default answer. A compact hybrid, EV with home charging, midsize crossover, minivan, or genuinely work-used pickup can each be rational under a different schedule.
Map every fixed trip, test I-35 and its alternatives at the actual hour, verify tolls by ramp and operator, and compare zero, one, and two-car arrangements. Revisit the decision after a move, job or shift change, school transition, transit opening, charging installation, or major construction phase.
Related guides
- Texas Region Guide
- Commute Cost Calculator
- Car Affordability Calculator
- Hybrid vs EV Monthly Calculator
- Public vs Home Charging Calculator
- Lease vs Finance Calculator
- Best Cars for Long Commutes
- Hybrid vs EV for City Drivers
- Best Cars for Multigenerational Households
- Best Cars for Asian American Families
- Charging at Condos and Apartments
- Dallas to Austin Road Trip
More Texas driving guides
Dallas–Fort Worth Car Ownership
A practical DFW ownership guide covering Dallas, Fort Worth, Plano, Frisco, and Arlington households, toll roads, TEXpress lanes, transit, theft, hail, heat, and charging.
Ownership realityHouston Car Ownership
A practical ownership map for Houston, Harris County, and Fort Bend County covering freeways, tolls, transit, freight, flooding, heat, theft, charging, family schedules, and airport duty.
Ownership mathTexas Ownership Costs, Tolls, Insurance, and Registration
Worked Texas car-cost math for sales tax, title, registration, the 2025 inspection change, EV fees, insurance, tolls, fuel, electricity, tires, and A/C.
Seasonal safetyTexas Seasonal Driving: Heat, Hail, Flooding, and Hurricanes
A statewide vehicle-preparedness guide for extreme heat, flash flooding, hurricanes, hail, tornadoes, wildfire, winter ice, fuel and EV reserves, DriveTexas, and official alerts.
Car cultureTexas Trucks, Slabs, Lowriders, and Motorsport
A respectful guide to working trucks, Houston slabs and swangas, lowriding, art cars, sanctioned racing, and the institutions that sustain Texas car culture.