
Los Angeles Commute Costs: What Your Freeway, Parking Space, and Office Schedule Really Cost
A corridor-by-corridor guide to I-405, I-10, I-110, Metro, Metrolink, express lanes, fuel, insurance, parking, and the monthly math behind getting to work in Los Angeles.
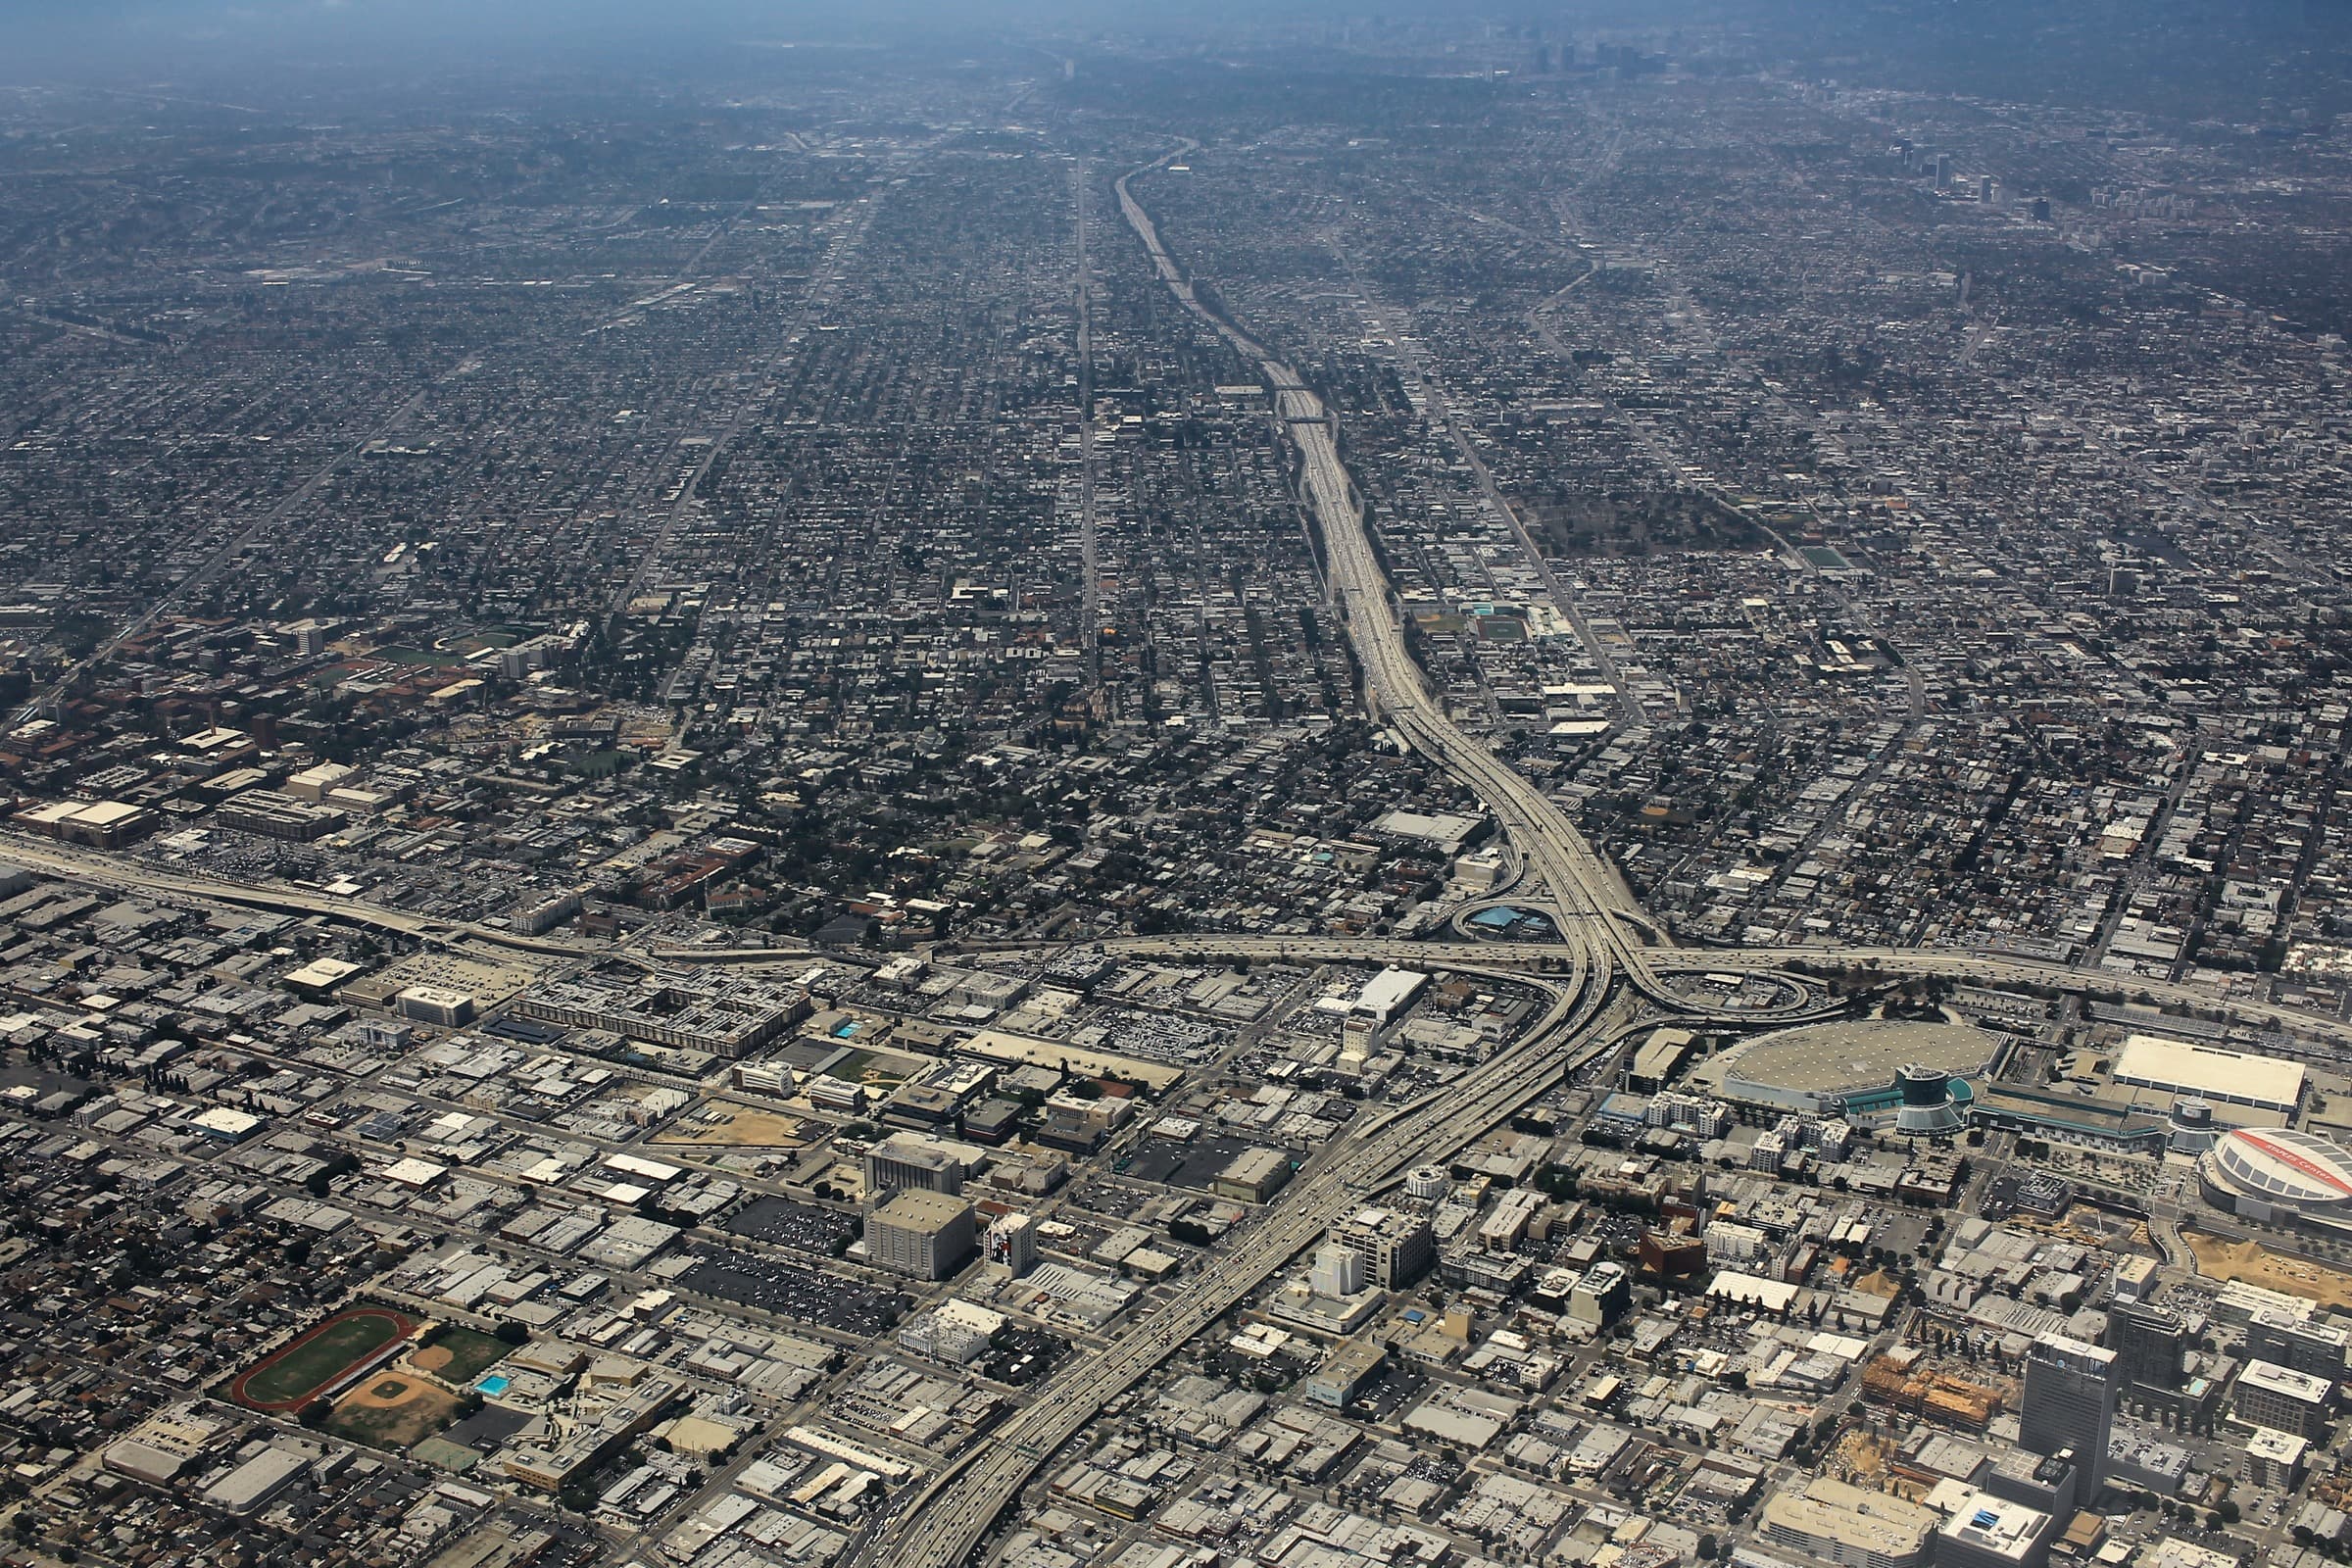
Key numbers for Los Angeles Commute Costs
- LA city mean commute
- 30.7 min
- Mean travel time to work for workers age 16 and older in Los Angeles city, based on 2020–2024 Census estimates. It is a citywide reference, not a prediction for any freeway corridor.
- California gasoline
- $4.528/gal
- The U.S. Energy Information Administration's 2025 California annual average for all gasoline grades. Replace it with a current neighborhood price when calculating a live commute.
- Metro base fare
- $1.75
- Regular one-way fare with free transfers for two hours when paid with TAP or another eligible payment method.
- Metro seven-day cap
- $18
- Regular riders using an eligible payment method do not pay more than $18 over a seven-day fare-capping period.
- Regional VMT recovery
- 98%
- SCAG-region vehicle miles traveled in December 2025 compared with the pre-pandemic baseline. Vehicle-hours driven recovered less fully, reflecting altered peaks and hybrid work.
- Delay from three freeways
- 47%
- Share of Caltrans District 7 freeway delay at the 35-mph threshold generated by I-405, I-5, and I-10 in Q2 2024. I-405 alone accounted for 22%.
- Typical Metro parking
- $3/day
- Many Metro park-and-ride facilities list $3 daily parking, although rates, availability, monthly permits, and event pricing differ by station.
- Mileage benchmark
- 76¢/mi
- IRS business mileage rate effective July 1, 2026. It is useful as a broad operating-cost benchmark but is not a literal commute expense or personal commute deduction.
Start with the corridor and schedule, not an LA average
Los Angeles does not have one commute. A 16-mile trip through the Sepulveda Pass, a 22-mile I-10 drive from the San Gabriel Valley, and a six-mile crawl from Koreatown to Century City can produce similar travel times while imposing very different fuel, parking, toll, and transit costs. The useful starting point is a weekly map: home, workplace, required arrival time, recurring stops, and the number of days the trip actually happens.
The Census Bureau puts Los Angeles city's mean travel time to work at 30.7 minutes for 2020–2024. That number includes many modes, directions, and schedules. It cannot tell a reader what northbound I-405 will do on a Tuesday morning or whether an incident on I-10 will erase the value of leaving 15 minutes later. Use live mapping for the actual departure window and the Census figure only to establish regional scale.
Caltrans District 7 reporting shows why corridor choice matters. In Q2 2024, I-405 generated 22% of freeway delay measured at the 35-mph threshold, I-5 generated 13%, and I-10 generated 12%. Together, those three routes produced 47% of recorded district delay. Reliability matters alongside distance: a shorter but volatile route may require more schedule buffer than a longer, steadier one.
Begin the budget with monthly commute miles. Multiply the round-trip distance by actual office days rather than by a generic 20-day month. A hybrid worker commuting three days per week may make about 13 round trips in a typical month. Someone working on-site five days per week may make 20 or 22. That difference can outweigh a modest change in fuel economy.
Then separate cash expenses from full ownership costs. Fuel, tolls, and workplace parking are immediate commute outlays. Insurance, depreciation, tires, repairs, registration, and financing belong to the wider ownership budget, although high annual commute mileage can increase several of them. Keeping the categories separate prevents a driver from pretending fuel is the whole cost or charging the commute for costs the household would incur anyway.
The basic worksheet is deliberately simple: monthly miles equal round-trip miles multiplied by commute days; monthly gallons equal miles divided by observed mpg; fuel expense equals gallons multiplied by the local pump price. Add destination parking, actual tolls, and station-access costs as separate lines. Use the site's Commute Cost Calculator to test changes rather than hiding dense arithmetic in prose.
The verified 2025 California average of $4.528 per gallon is a baseline, not a promise about a neighborhood station in July 2026. Run the budget again at the current local price and at 50 cents above it. The IRS rate of 76 cents per business mile, effective July 1, 2026, can illustrate the scale of fuel, maintenance, depreciation, and other operating costs together, but ordinary commuting is not deductible and the rate should not be presented as a personal bill.
Insurance also resists a regional average. California's Department of Insurance publishes a 2026 comparison tool built from hypothetical profiles because ZIP code, driver record, coverage, annual mileage, and exact trim change the result. Obtain bindable quotes before treating a more efficient or more expensive car as the commute solution.
Freeways, express lanes, parking, and transit alternatives
I-405 is the defining north–south constraint between the San Fernando Valley and Westside, especially through the Sepulveda Pass. Seat comfort, low-speed efficiency, quiet ventilation, and predictable driver-assistance behavior can matter more here than acceleration. Metro selected an underground heavy-rail alternative for the future Sepulveda Transit Corridor in January 2026, but that project is not a current commute solution and its delivery schedule should be checked before a future update.
I-10 carries Westside, Downtown, East Los Angeles, and San Gabriel Valley trips. Metro's existing I-10 ExpressLanes use dynamic pricing designed to manage demand and preserve speeds. Solo drivers pay the displayed toll; qualifying carpools need the correct FasTrak Flex setting to receive applicable treatment. The planned extension east of I-605 remained in environmental review, with a draft environmental document expected in 2026.
I-110 offers another dynamically priced corridor between the South Bay and Downtown. A toll should be modeled as a purchased reliability option, not as a fixed daily charge. Record several representative trips or use account history. Paying on two mornings with immovable meetings can be rational; assuming the express lane is necessary twice every weekday may exaggerate the budget.
California's Clean Air Vehicle decal program ended September 30, 2025. An EV no longer receives the former solo HOV or reduced-toll benefit merely because it has an old decal. Drivers must follow posted occupancy and toll rules. This changes the value proposition for shoppers who remember express-lane access as an EV advantage.
Orange County's 73, 133, 241, and 261 Toll Roads matter for some cross-county commutes. Rates effective July 1, 2025 vary by road, entry and exit, time, axle count, and account status. Use the official toll calculator for the actual trip rather than importing a single Orange County toll into a Los Angeles budget.
Parking can exceed fuel. City-operated examples include a $20 daily maximum at 530 S. Olive Street and $25 at 225 N. Los Angeles Street. Those examples are not citywide averages, but they show why the exact workplace garage belongs in the calculation. Paid parking in Los Angeles also carries a 10% Parking Occupancy Tax, while LADOT Express Park meter rates vary with demand in Downtown, Westwood, Hollywood, and Venice.
Metro offers a $1.75 regular base fare, free two-hour transfers, a $5 daily cap, and an $18 seven-day cap for eligible payment methods. Many park-and-ride facilities list $3 daily parking, but station and event rules vary. A drive-to-rail commute needs four lines: station-access miles, station parking, transit fare, and the final mile.
Metrolink's July 2025 fare changes added a five-day flex product, lowered most monthly-pass prices, and retained distance-based pricing. A monthly pass can work well for frequent riders, while a hybrid worker may be better served by individual tickets or a flex product. Check the current origin-and-destination fare rather than printing one regional average.
The D Line extension changed Mid-Wilshire calculations when its first section opened May 8, 2026. New stations at Wilshire/La Brea, Wilshire/Fairfax, and Wilshire/La Cienega can remove destination parking from some trips. Sections toward Century City and Westwood were forecast for 2027 and should be treated as update-sensitive until operating.
SCAG reported that regional VMT had returned to 98% of the pre-pandemic level by December 2025 while vehicle-hours driven stood at 74% of that baseline. It also estimated that 33% of paid workdays in its regional sample were performed at home during 2025. Hybrid work changed peak demand without making every occupation flexible, so use the reader's employer policy rather than a regional assumption.
The commute math by corridor
These are route contexts rather than traffic predictions. Substitute an actual origin, destination, departure window, parking arrangement, and office cadence.
San Fernando Valley to the Westside
I-405 and Sepulveda Pass trips combine short map distances with severe reliability risk.
- ·Prioritize seat comfort, quiet HVAC, and low-speed efficiency
- ·Compare employer parking with a G Line connection
- ·Do not price the future Sepulveda subway as if it operates today
San Gabriel Valley to Downtown or the Westside
I-10, SR-60, I-210, Metro A Line, Metrolink, and express buses create several combinations rather than one default route.
- ·Model I-10 tolls from actual usage
- ·Test park-and-ride against the workplace final mile
- ·Price the A Line and Metrolink separately because they serve different schedules
South Bay to Downtown
I-110 ExpressLanes can buy reliability, while the J Line can remove parking from the equation.
- ·Record toll use by trip instead of assuming a maximum
- ·Compare Harbor Gateway parking and transit time
- ·Include event-related parking or service changes
East and Southeast LA County
I-5, I-605, SR-60, and I-10 connectors can make interchange reliability more important than straight-line distance.
- ·Use observed route-specific mileage
- ·Allow for freight interaction and connector delays
- ·Compare household vehicle roles before upsizing both cars
Downtown, Hollywood, and Westside destinations
The final parking charge may dominate the commute even when mileage is modest.
- ·Verify employer subsidy and post-tax employee cost
- ·Include the Los Angeles Parking Occupancy Tax
- ·Recalculate after a rail opening or office relocation
Orange County cross-commutes
I-5, I-405, SR-91, and the 73/133/241/261 network can add separate toll systems and longer annual mileage.
- ·Use official trip-specific toll calculators
- ·Price fuel, tires, and depreciation at the actual annual mileage
- ·Check whether Metrolink endpoints fit the work schedule
Costs that change through the year
Fuel-price changes
- ·Use $4.528 per gallon only as the verified 2025 California baseline
- ·Replace it with a current local price before making a decision
- ·Run sensitivity at 50 cents above and below the baseline
Hybrid schedules and event months
- ·Count actual office days
- ·Check event parking at Metro lots and destination garages
- ·Recalculate if return-to-office policy changes
Heat, smoke, and closures
- ·Heavy AC use can lower real-world efficiency
- ·Poor air or closures can alter roads and transit service
- ·Keep enough fuel or charge for an unplanned detour
Worked Los Angeles commute scenarios
44-mile round trip, 20 days, 30-mpg car
Monthly mileage is 880 miles. At 30 mpg and the verified 2025 California average of $4.528 per gallon, fuel is about $132.82. Add $20 parking for 20 days and parking contributes $400, producing a $532.82 cash subtotal before tolls, insurance, maintenance, or depreciation. The parking decision matters far more than a small mpg improvement.
The same trip in a 50-mpg hybrid
Fuel falls to about $79.69, saving $53.13 per month versus the 30-mpg car. Compare the hybrid's payment, tax, insurance, tire, and depreciation premium with that $53 monthly saving. Do not compare the premium with the entire gasoline bill.
Three office days per week
Thirteen monthly round trips produce 572 miles. At 50 mpg and $4.528 per gallon, fuel is about $51.80. Thirteen days of $20 parking add $260, producing a $311.80 subtotal. Office cadence has saved more than the powertrain change.
Metro with paid park-and-ride
Four-and-one-third seven-day periods at the $18 cap equal a theoretical $77.94 monthly fare ceiling. Twenty weekdays of $3 station parking add $60, for an illustrative $137.94. Actual fare-cap timing, station rules, event prices, access mileage, and first- or last-mile costs can change that result.
Selective express-lane user
A commuter with two immovable morning meetings per week should total the tolls for those trips rather than pricing ten weekly tolls. Express lanes are most defensible when the purchased reliability has a clear work or caregiving value.
A car that costs 76 cents per mile
At the IRS benchmark, 880 monthly miles represent $668.80 of broad vehicle cost. That is not a personal tax deduction or an invoice, but it is a useful warning that a $132.82 fuel calculation does not capture depreciation, maintenance, tires, registration, and insurance.
EV, hybrid, and gasoline choices for an LA commute
A home-charged EV can reduce energy spending on a predictable commute, but the calculation requires the household's actual utility rate, charging window, and observed miles per kilowatt-hour. Public fast charging should not be priced as if it matches residential electricity.
A hybrid remains strong where charging is uncertain, commute mileage is high, and the household needs effortless long-distance flexibility. Its advantage should be measured against the exact vehicle being replaced rather than against an inefficient hypothetical SUV.
A PHEV works only when it is plugged in frequently enough to cover recurring local miles. Without dependable charging, it carries additional weight and mechanical complexity while operating largely as a gasoline hybrid.
Insurance requires an exact ZIP-code, driver, coverage, and trim quote. California's 2026 comparison tool uses hypothetical profiles and should not be converted into a single LA average.
The old clean-air decal is no longer an express-lane reason to buy electric. Compare energy cost, charging control, insurance, tires, and purchase price without assigning the vehicle a benefit that ended in September 2025.
What to carry into the showroom
A defensible Los Angeles commute budget begins with five inputs: round-trip miles, monthly office days, observed efficiency, destination parking, and actual toll use. Add transit access and an exact insurance quote before allowing a low payment or high EPA rating to decide the purchase.
Driving earns its cost when it reliably solves time-sensitive or multi-stop routines. Rail earns the inconvenience of a transfer when it removes unpredictable traffic and expensive parking. A more efficient vehicle earns its premium only when verified monthly savings repay the additional ownership cost.
Recalculate after an office move, schedule change, new rail opening, parking-price increase, or toll-policy change. Los Angeles transportation changes too quickly for a one-time commute estimate to remain useful indefinitely.
Related guides
- Southern California
- Los Angeles Car Ownership
- SGV & Inland Empire Car Ownership
- Commute Cost Calculator
- Car Affordability Calculator
- Hybrid vs EV Monthly Calculator
- Public vs Home Charging Calculator
- Best Cars for Long Commutes
- Hybrid vs EV for City Drivers
- First Luxury Car Guide
- Los Angeles to San Diego
- Los Angeles to Palm Springs
- Los Angeles to Big Sur
More SoCal driving guides
Orange County Car Ownership: Tolls, Freeways, Charging, and Family Routines
A practical guide to owning a car in Orange County, from I-5 and I-405 construction to toll roads, home charging, school runs, John Wayne Airport, and Anaheim resort traffic.
Seasonal safetySouthern California Seasonal Driving: Mountains, Wildfire, and Desert Heat
Prepare a Southern California vehicle for mountain chain controls, wildfire evacuation, smoke, extreme heat, desert breakdowns, and changing EV range without turning the guide into an itinerary.
Car cultureSouthern California Car Culture: Lowriders, Imports, Motorsport, and Community
A grounded guide to Southern California lowriders, Japanese American and import history, museums, motorsport, cars-and-coffee, and the etiquette that keeps enthusiast spaces welcoming.
Ownership realityLos Angeles Car Ownership
Parking permits, street sweeping, theft, apartment charging, heat, and a practical test for whether a car earns its space in Los Angeles.
SGV & Inland EmpireSan Gabriel Valley & Inland Empire Car Ownership
I-10, SR-60, I-210, supercommutes, heat, multigenerational routines, and vehicle needs across the San Gabriel Valley and Inland Empire.